


 We tell ourselves (and our leadership) that we are doing everything we can to promote a call to action or get the word out about an association event. But if we can’t prove it with data (or are using the wrong analytics), then our communications and marketing efforts risk becoming irrelevant.
Online analytics can reveal a surprising amount about the communications we send out via e-mail, Web sites, social media, and texting: how many readers, from which groups, how long each reader spent with the content, how many shared the content, how many clicked through to the video, and much more. If you’re not paying careful attention to these numbers, you could be wasting a lot of effort.
You may think if you increase the effectiveness of any 10 channels by even 10 percent that you’ll as much as double your reach. But the reality is that you must focus on increasing the effectiveness of your highest-priority channels since that’s where you can gain exponential results due to the compounding effect on other metrics. The payoff will be a higher adoption rate of member services, a filled house for your next big event, or an increase in membership satisfaction.
So how do you know which channels to focus on?
When you choose a marketing channel to promote your next opportunity, class, or offer, carefully consider the metrics you can use to measure the campaign’s success. Following are the most telling metrics, listed by channel, as well as advice on how to improve each one.
Web site
A high “bounce rate” signifies that your Web site may not be retaining visitors. It means people visit, look at it, and leave quickly. Find the bounce rate in your Google Analytics. Anything higher than 50 percent means your site may need improvement. Maybe people visit, can’t quickly find what they’re looking for, and leave. Maybe they clicked through from your newsletter and what they found wasn’t of interest. Maybe they visited to see what’s new and found only stale content. One easy way to reduce “bounce” is to make sure click-through links (i.e., “read more online,” “find it on our Web site,” “register online”) have correlating content. You should also supply fresh content regularly with new blog articles, videos to watch, or by adding a comments area to keep people engaged.
Another important metric to watch in your Google Analytics report is “new” versus “returning” visitors, and how these two segments behave on your site when they get there. When you have a very high percentage of new visitors, it means your site is not attracting returning visitors (those who view your site regularly). Regular visitors are more likely to notice and participate in all of the other offerings on your site. Once you hook them, keep them hooked by maintaining a regular supply of fresh content.
Another telltale statistic is the conversion rate from an offer page (any Web site page where you’re asking visitors to actually register for or buy something). This number, which is equal to how many bought or registered divided by the number of people who saw the page, lets you know how well you convinced visitors to actually commit or how easy the sign-up or purchase experience was.
Social media
Social media “engagement” is how many times someone interacts with each of the social media channels by liking, commenting, tweeting, sharing, and so on. As engagement goes up, so does your reach.
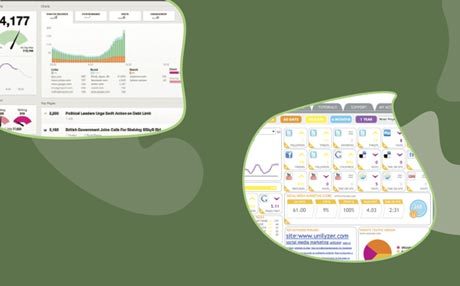
Each platform (Facebook, Twitter, Pinterest, LinkedIn, Google+) offers its own set of analytics, but there’s also a growing array of social metric dashboards (chartbeat.com, unilizer.com, and hootsuite.com, to name a few) that supply real-time data from multiple accounts and provide a report that demonstrates which social channels are working and which aren’t.
Facebook offers additional tools to help improve your reach, including paid “promoted posts” that push posts higher in recipients’ news feeds and keep them promoted longer. These are effective in increasing reach and click-through rates, some REALTOR® associations report.
E-mail deliverability is always a priority in association communication plans. Getting your e-mails past the server and software maze, through the blacklisting and junk mail filters, and into recipients’ inboxes is harder than ever. But you can increase the likelihood that your e-mails are not blocked, returned, or put in the spam folder.
One important step is to find your e-mail sender score. Like a credit score, a sender score is an indication of the trustworthiness of an e-mail source, compiled through data aggregated from 60 million mailboxes at a variety of ISPs, spam filtering, and security companies. This is the same type of data that mailbox providers use to determine whether to accept or reject e-mail. Check your sender score for free by entering your IP address at senderscore.org.
Once the delivery rate increases, the “opens” rate goes up, resulting in more clicks. And when there are more clicks, more members take action.
Video
The video attention rate (how long visitors spend watching your video) is the best metric for video efficacy. A simple number of views can be misleading because it counts someone even if they view a five-minute video for five seconds, then leave.
YouTube offers built-in analytics for your videos, but there are other services you can subscribe to (e.g., Google Analytics event tracking) that will track the reach of your video across multiple channels.
Improve the attention rate of your videos by (in the video itself) asking provocative questions to gain interest or using an interview format featuring members. (See more video tips in Lights, Camera, Action!)
Mobile
Not sure how many members are viewing your e-mail, Web site, or MLS with a mobile device? Analytics can tell you. A variety of tools, including Google Analytics, can reveal what kind of device your members are receiving your communications on and whether the mobile users spend more or less time reading than computer users. This can be a real eye-opener for how you format and design your messages.
Beyond the numbers
If you really want to know what’s happening with your visitors—not just by the numbers—consider the variety of Web site add-on services, such as clicktale.com and crazyegg.com, that enable you to actually record what individual visitors are doing on your site, including their mouse movements, clicks, and scrolls. Mouse movement is strongly correlated with eye movements, so it’s an excellent method for analyzing your site’s usability. Are visitors clicking on a logo or picture that’s not a link? Make it one. Are they scrolling several times up and down the page? Then they probably can’t find what they’re looking for.
More sophisticated services (Optimize.ly) enable you to deploy several versions of the same Web page, collect data on users’ interaction with them, then pick the winner (the one with the highest conversions, longest staying time, etc.).
Improve your aim
We know the days of just putting your message out there are long gone. Some members respond to one type of communication, and some to another. Today most of your members are on one social network; tomorrow they’ll be on something new. The constant struggle to hit this moving target isn’t going to get easier, but at least with analytics, you can improve your aim.