


 With a slowdown in global economic activity, financial market volatility and a contentious presidential campaign, commercial real estate investors have taken a step back in the early months of 2016. The U.S. economy sputtered during the first quarter of 2016, with gross domestic product advancing at a weak 1.0 percent annual rate. The corporate outlook took a downward turn, while international trade bore the brunt of a soft economic environment and rising dollar. However, the markets remained divided along valuation lines, with small cap commercial real estate maintaining momentum against the broader moderation.
Small Cap Markets Maintain Momentum
Commercial sales transactions span the price spectrum, but tend to be measured and reported based on size. Commercial real estate deals at the higher end—$2.5 million and above—comprise a large share of investment sales, and generally receive most of the press coverage. Smaller commercial transactions tend to be obscured given their size. However, the REALTORS® Commercial Real Estate Market Trends shines the spotlight on small cap commercial real estate markets.
Commercial transactions in large cap markets dropped in Q1 of 2016. The volume of commercial sales totaled $111 billion, a 20 percent year-over-year decrease, according to Real Capital Analytics (RCA). The nominal decline was partly due to unusually high portfolio deals which closed in the first quarter of 2015. Investor hesitation was evident in pricing, as cap rates were flat for the past three quarters, at 6.7 percent. Prices in markets covered by RCA gained 8.6 percent during the first quarter of 2016. The advance was driven by strong appreciation in values of retail and apartment properties, which advanced 11.8 percent and 11.2 percent, respectively. Prices for office properties in central business districts (CBD) advanced at a solid 10.5 percent.
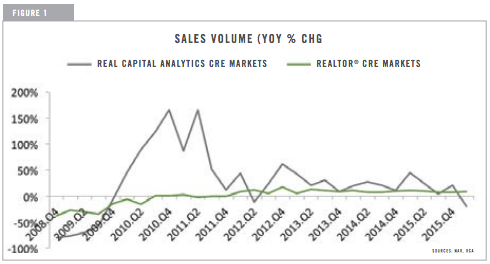
In comparison, commercial real estate in small cap markets maintained its upward momentum during the first quarter, with REALTORS® reporting continued improvement in fundamentals and investment sales. The volume of investment sales in REALTOR® markets totaled $51.6 billion during the first quarter, 8.5 percent higher than the first quarter of 2015. Inventory shortage drove price growth, with commercial properties exchanging hands at average prices 5.1 percent higher compared with the same period in 2015. Average capitalization rates declined to an average 7.2 percent across all property types, a 57 basis point compression on a yearly basis. (See Figure 1)
Lending Conditions Tighten
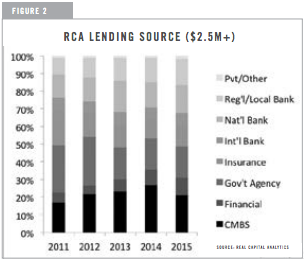 While capital markets proved favorable during 2015, this year investors are finding soft spots in debt markets. In the large cap commercial real estate space, most sources of funding remain active, competing for market share. The main exceptions have been issuers of commercial mortgage backed securities (CMBS), who have tamped down the origination flow, with $19.0 billion in new issues during the first quarter of 2016, down 29.6 percent year-over-year. Based on RCA data, CMBS originators accounted for about one-in-five transactions at the high end of the market, followed by government-sponsored enterprises (GSEs). The third largest funding source comprised of national banks, with 16.0 percent of total transactions. Regional and local banks made up 15.0 percent of total volume. (See Figure 2)
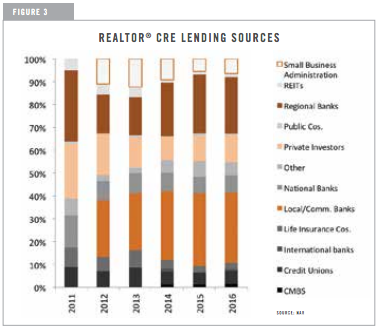 Based on the REALTORS® Commercial Real Estate Lending Trends 2016, capital markets display a fundamentally different landscape. Local and community banks were the largest lending group in 2015, accounting for 31.0 percent of transactions. Regional banks were the second largest capital source in 2015, with 25.0 percent of REALTORS®’ commercial deals. Private investors were the third main capital providers, accounting for 12.0 percent of deals during 2015. National banks came in fourth place, with 8.0 percent market share. (See Figure 3)
The data highlights the marked differences in large cap versus small cap markets. Debt financing represents a much-larger portion of capital in small cap markets. For regional and community banks—which account for 56.0 percent of all capital in REALTOR® markets—compliance costs stemming from financial regulations have made a stronger impact on available capital for deals. With rising operating costs and higher capital reserve requirements for loans, regional and community banks have been more cautious, resulting in tightening of capital. 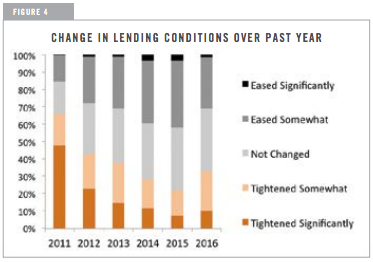 Over the past months, over a third of REALTORS® reported tightening lending conditions, compared with 22.0 percent in 2014 and 28.0 percent in 2013. In addition, 59.0 percent reported insufficient bank capital remains an obstacle to sales in their markets. (See Figure 4)
Outlook
Looking ahead at the second half of 2016, the GDP annual rate of growth will pick up modestly. However, in light of the weak first quarter, the annual growth is pegged at 1.6 percent. Payroll employment is projected to post 1.6 percent annual growth rate for the year, with the unemployment rate estimated to fall to 4.7 percent by the end of 2016. Commercial fundamentals continue on an expansionary path, with three of the four core sectors tilting in landlords’ favor. On the investment side, financial markets’ jitters about interest rates will likely dampen the sales pace in large cap markets. In small cap markets, increased scrutiny from banking regulators has already tightened lending conditions.
However, in light of current global uncertainty, U.S. commercial real estate is likely to remain an attractive alternative for investors this year. Investors will probably take a more measured approach, leading to a moderation in prices. With cap rates at very low levels and interest rates expected to rise, the price slowdown is projected to impact Class A assets in top-tier markets, where inventory shortages and crowding of capital have led to the recent runups. Properties in smaller markets, where the recovery only began in 2013 are likely to see continued price appreciation.
This article appears in the Commercial Connections issue Summer 2016: Building Opportunities, Community & Our Future.