


AMERICA'S LARGEST TRADE ASSOCIATION
1.5 Million+
collective force of real estate professionals who subscribe to a strict Code of Ethics.
Find a REALTOR®.
Find a REALTOR®.
https://www.nar.realtor/code-of-ethics
115 Years
advocating and protecting the rights of property buyers and sellers in the U.S. and around the world. Discover Our History.
https://www.nar.realtor/about-nar
1,200
local and state/territory associations serving REALTORS® and their communities. Find one near you.
https://www.nar.realtor/directories
200,000+
REALTORS® holding subject matter expertise designations & certifications. Learn more.
https://www.nar.realtor/education/designations-and-certifications
Providing REALTORS® a Platform for Success


Membership

Research & Statistics
Advocacy

Education


Discover the incredible ways REALTORS® are serving their communities and customers.

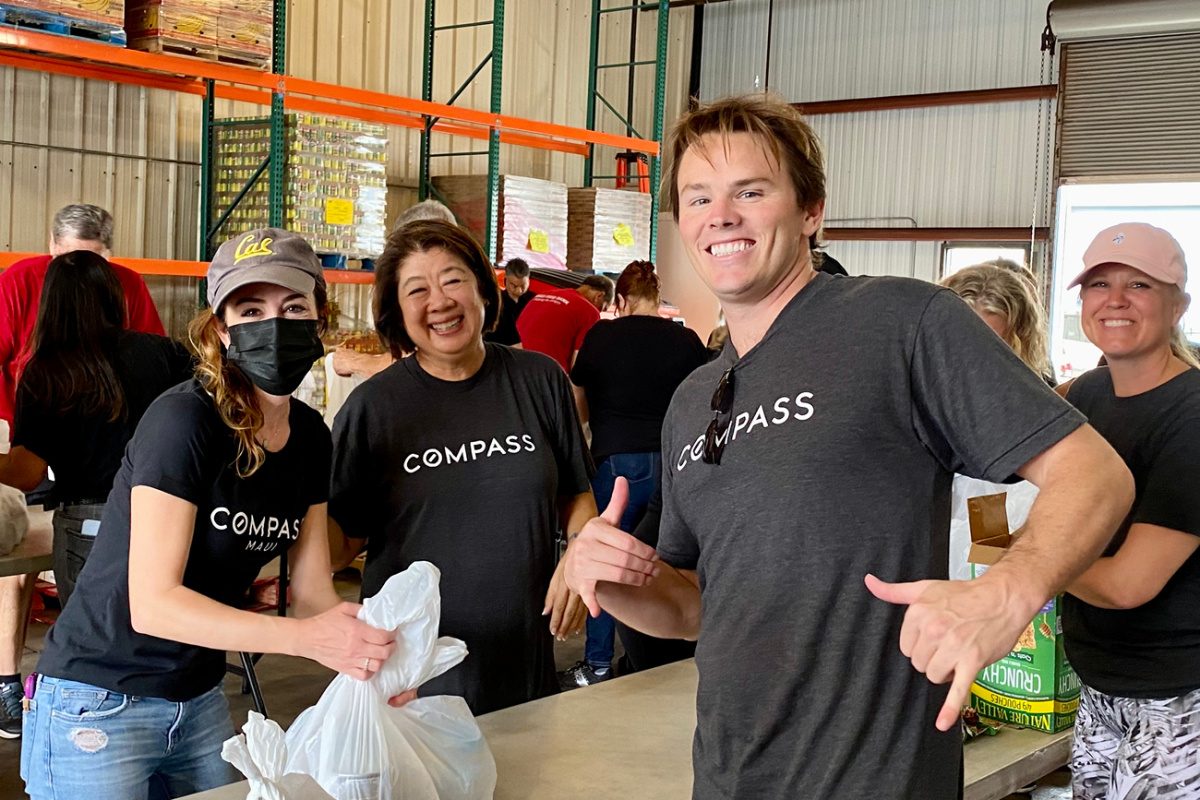
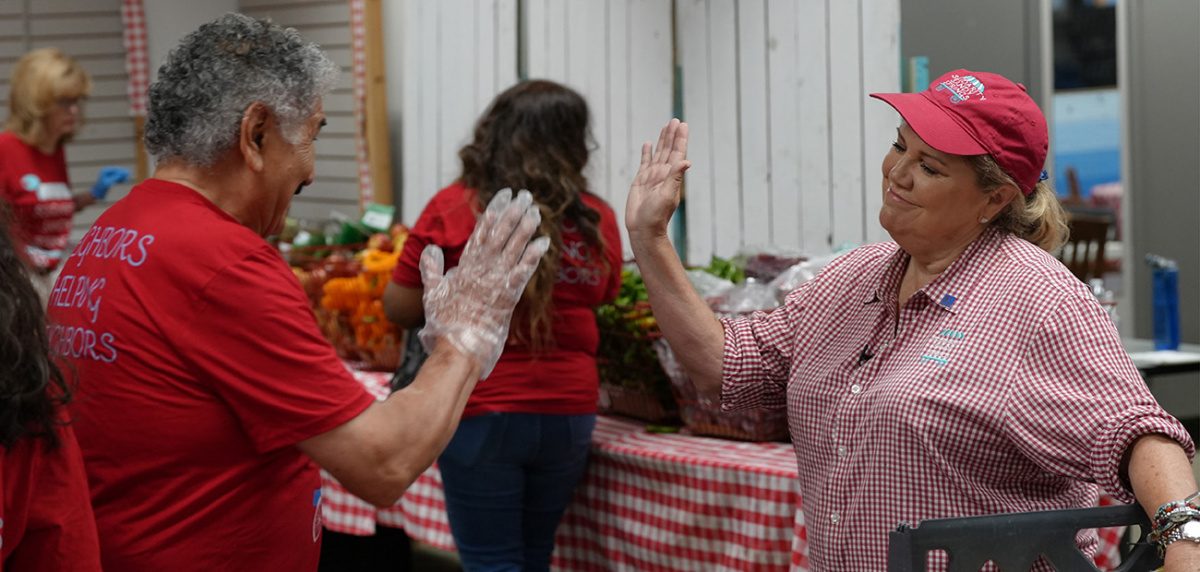
Building Unity in the Fight Against Hunger
REALTOR® Debbie Arakaki, a loyal supporter of the Maui Food Bank, has raised $262,888 since 2015, providing 1.05 million meals. She recently helped create the Maui Pono Foundation to support families and small businesses that lost everything in the Lahaina fire.
https://www.nar.realtor/good-neighbor-awards/building-unity-in-the-fight-against-hunger

Tempering a Community's Trauma
In the aftermath of a mass shooting at a 2022 July 4 parade in Highland Park, Ill., REALTOR® Betsy Brint spearheaded the effort to distribute $5.8 million in donations to help her community cope with its collective trauma and find its way forward.
https://www.nar.realtor/good-neighbor-awards/tempering-a-communitys-trauma

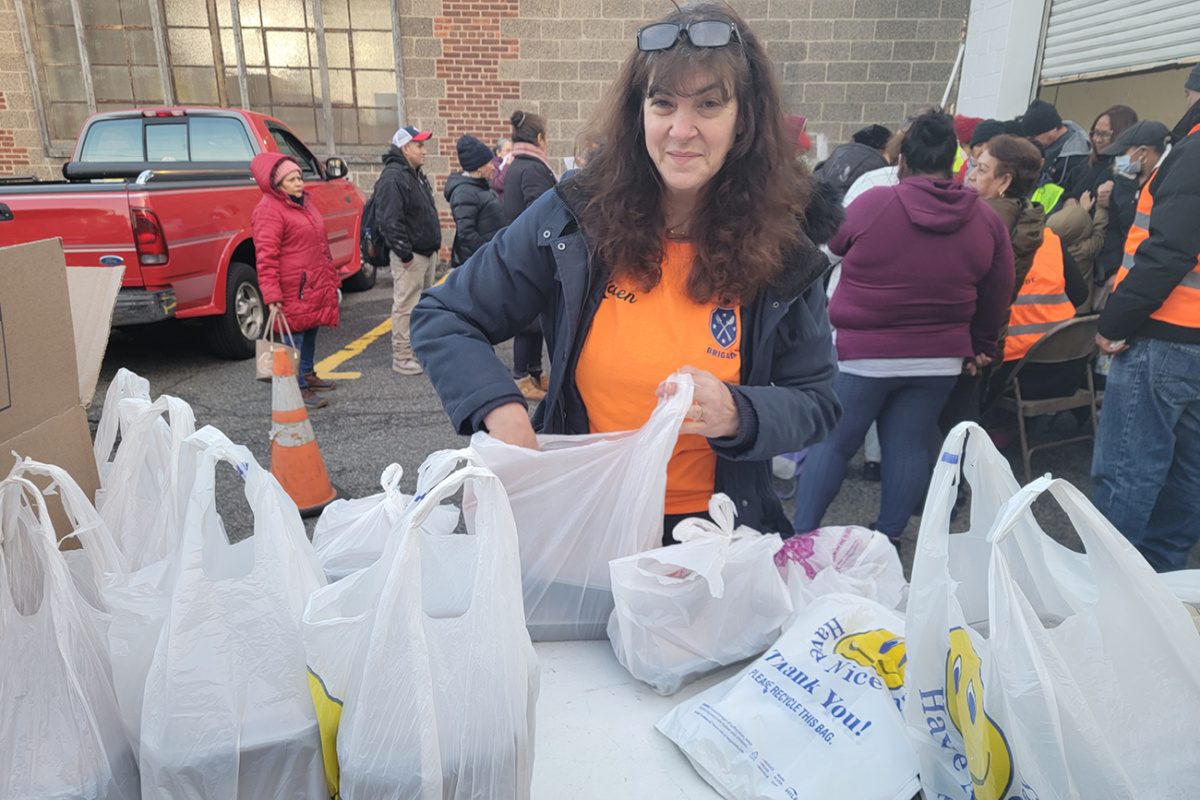
Feeding Hearts and Bellies in New Jersey
In a span of three years, REALTOR® Karen DeMarco went from serving meals from her driveway to creating a food pantry network that has provided 1,774 tons of food to tens of thousands of people over three counties in New Jersey.
https://www.nar.realtor/good-neighbor-awards/feeding-hearts-and-bellies-in-new-jersey

Empowering Hope by Transforming Kids’ Lives
REALTOR® Rick Furnish founded South Dakota Kids Belong to facilitate collaboration between government, faith, business and the creative sector and bring about a stronger foster care system. He also volunteers with Hope Ranch International, which has supported orphans worldwide for more than two decades.
https://www.nar.realtor/good-neighbor-awards/empowering-hope-by-transforming-kids-lives

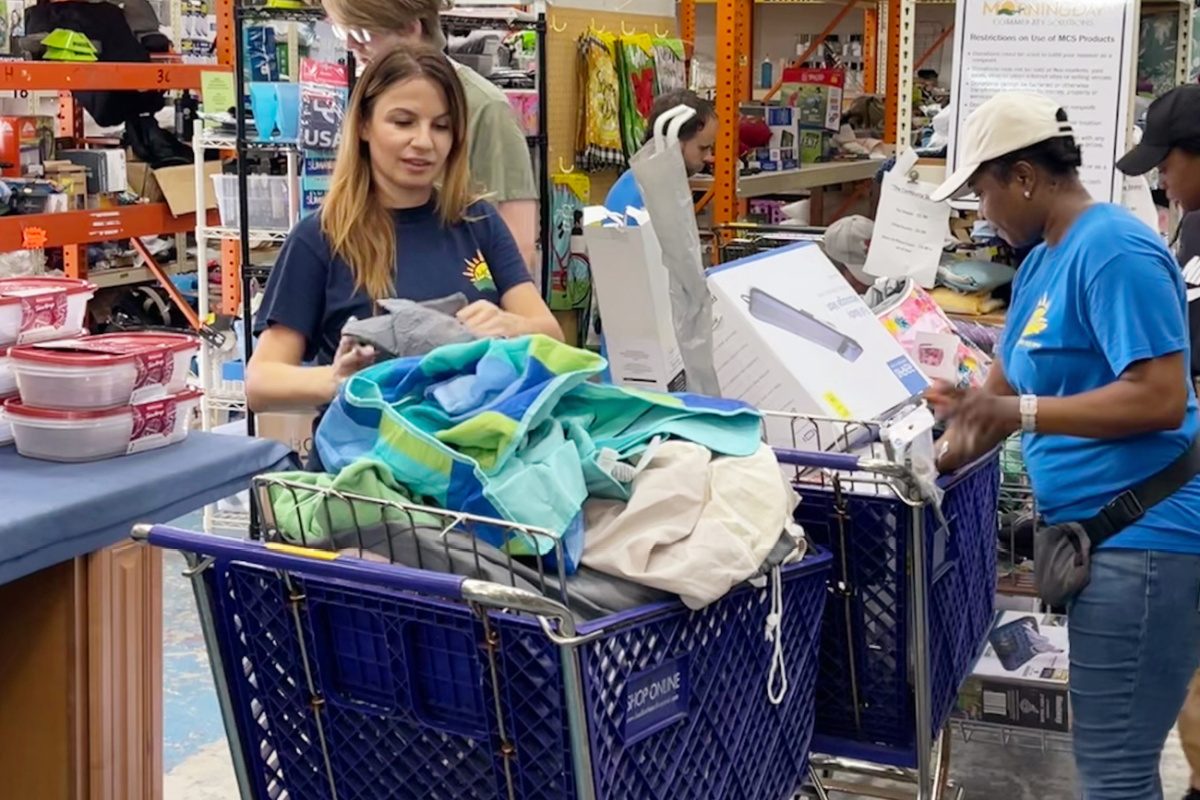
The Power of Good(s)
REALTOR® Kasia Maslanka co-founded Morningday Community Solutions with the goal of redirecting excess products from businesses to people who need them. Over 13 years, they’ve saved nonprofits $9 million and keep 400 tons of unused products out of landfills every year.
https://www.nar.realtor/good-neighbor-awards/the-power-of-goods

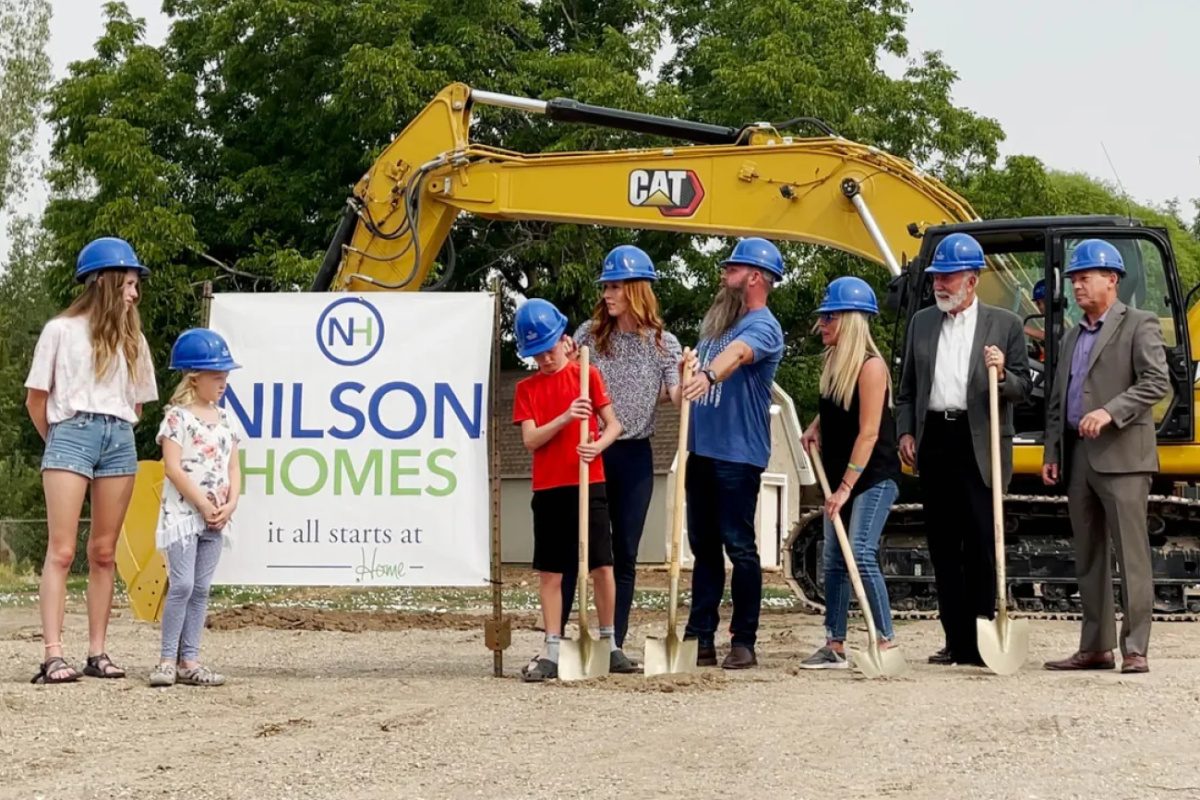
Family Homes Are the Family Business
Through Have a Heart Home, Jed Nilson, REALTOR® and owner of Nilson Homes, has volunteered his time, team, labor, and resources to build 15 homes for families in need. These homes are sold at deeply discounted prices to families who could otherwise not afford homeownership.
https://www.nar.realtor/good-neighbor-awards/family-homes-are-the-family-business

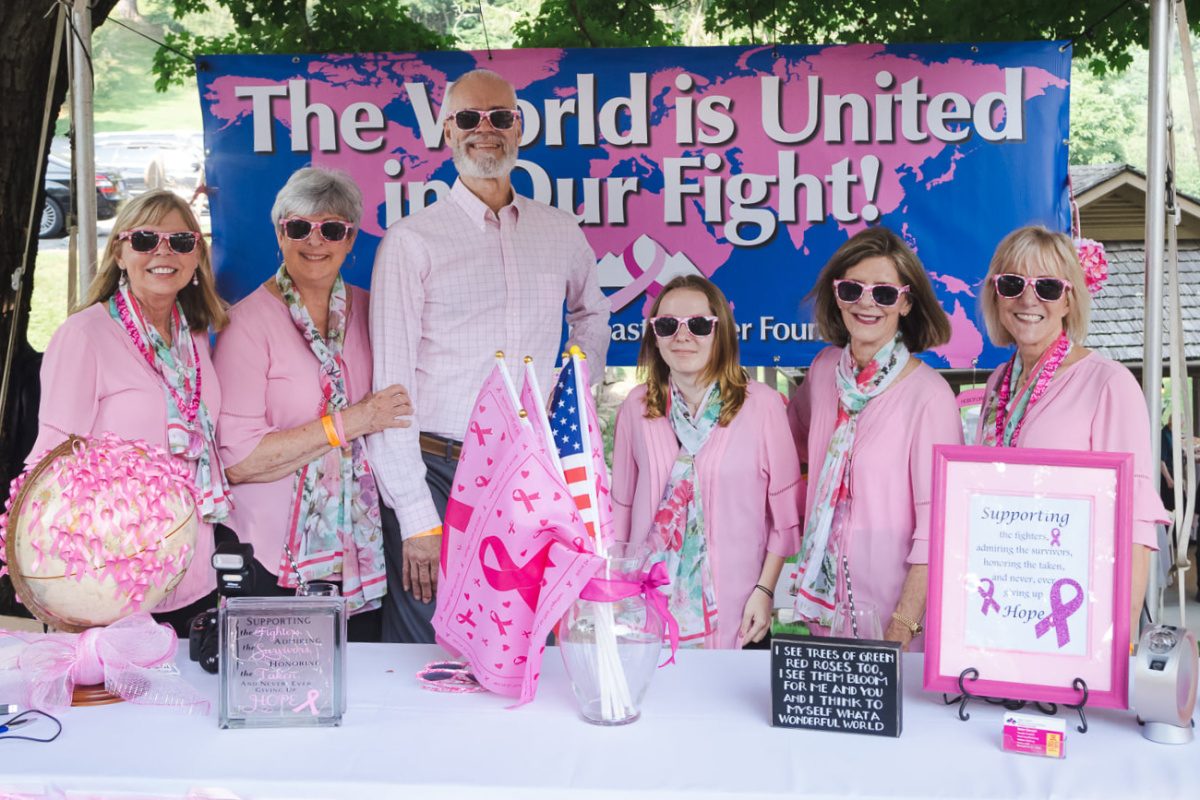
Fighting Breast Cancer Together
Breast cancer survivor and REALTOR® Irene Sawyer founded a nonprofit that helps breast cancer patients pay medical bills and purchase mastectomy bras, breast prostheses, and other cancer garments. She’s raised more than $230,000 in donations and personally donated around $200,000 to the organization.
https://www.nar.realtor/good-neighbor-awards/fighting-breast-cancer-together


Changing Lives With Hope
In 2003, REALTOR® Sandra Shank opened Hope House as a haven for teenage boys in Florida’s foster care system. For 20 years, she has housed and cared for 300 of the most vulnerable boys and now plans to break ground on an affordable housing project to provide holistic care for troubled families.
https://www.nar.realtor/good-neighbor-awards/changing-lives-with-hope

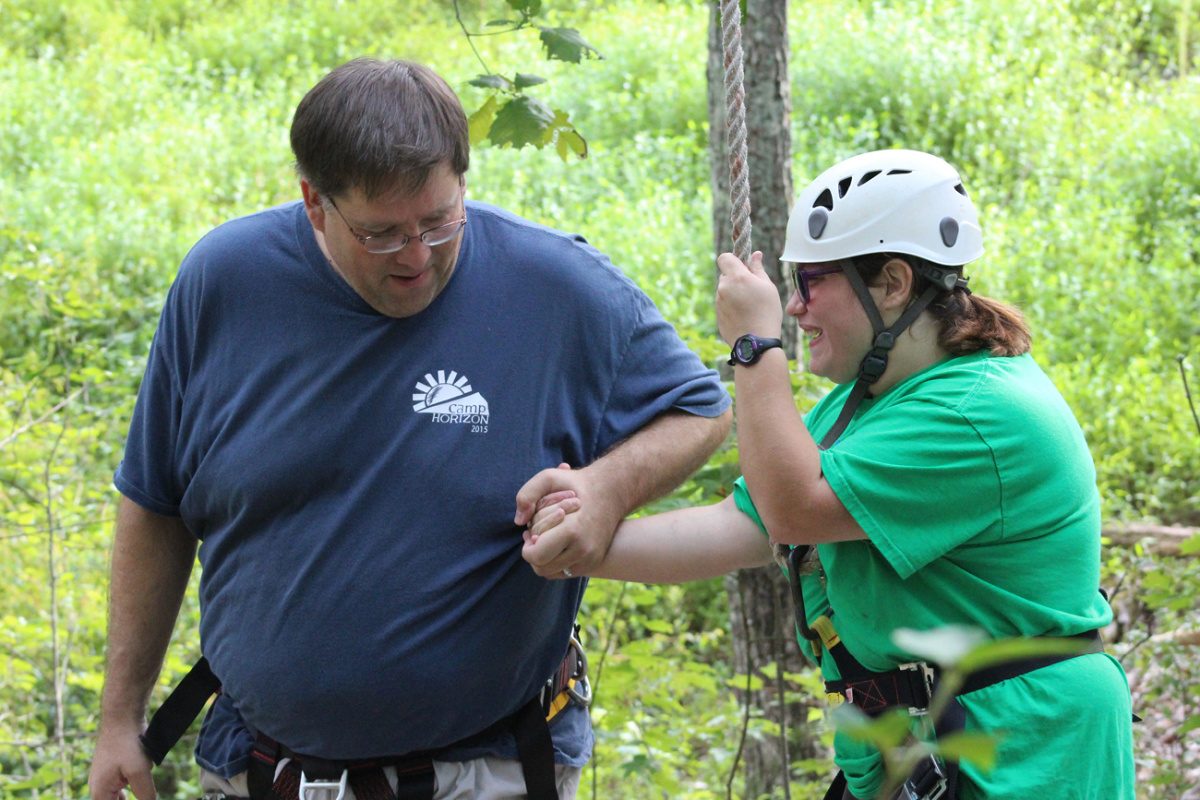
Seeing Beyond Their Horizons
With his wife, Lindsey, REALTOR® Steven Sharpe established Camp Horizon, giving kids with disabilities the opportunity to experience summer camp one weekend each year. Since 2005, the camp has provided 540 children with the opportunity to enjoy the great outdoors.
https://www.nar.realtor/good-neighbor-awards/seeing-beyond-their-horizons

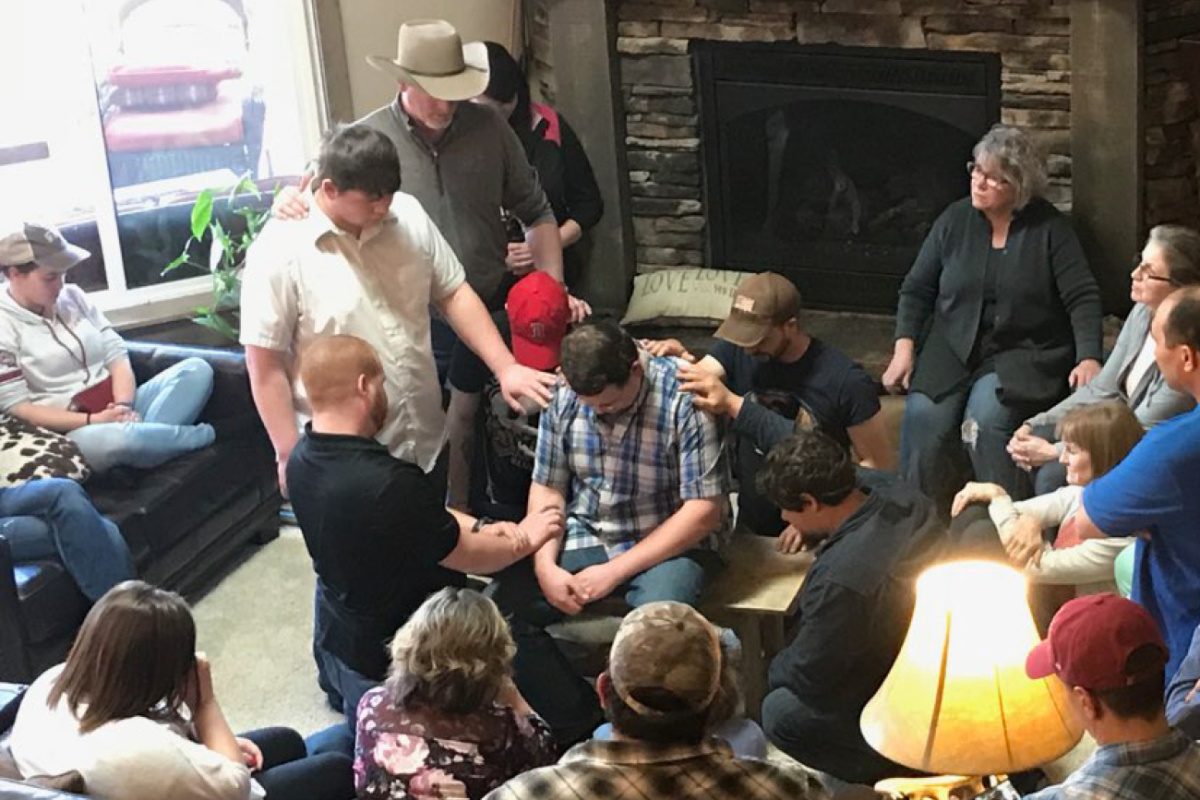
Bridge to a Purpose-filled Life
REALTORS® Anita and Jay Sherley established Life Houses LLC, a nonprofit that houses and mentors at-risk young men and women, helping them build skills and transition to productive, goal-oriented lives of purpose.
https://www.nar.realtor/good-neighbor-awards/bridge-to-a-purpose-filled-life

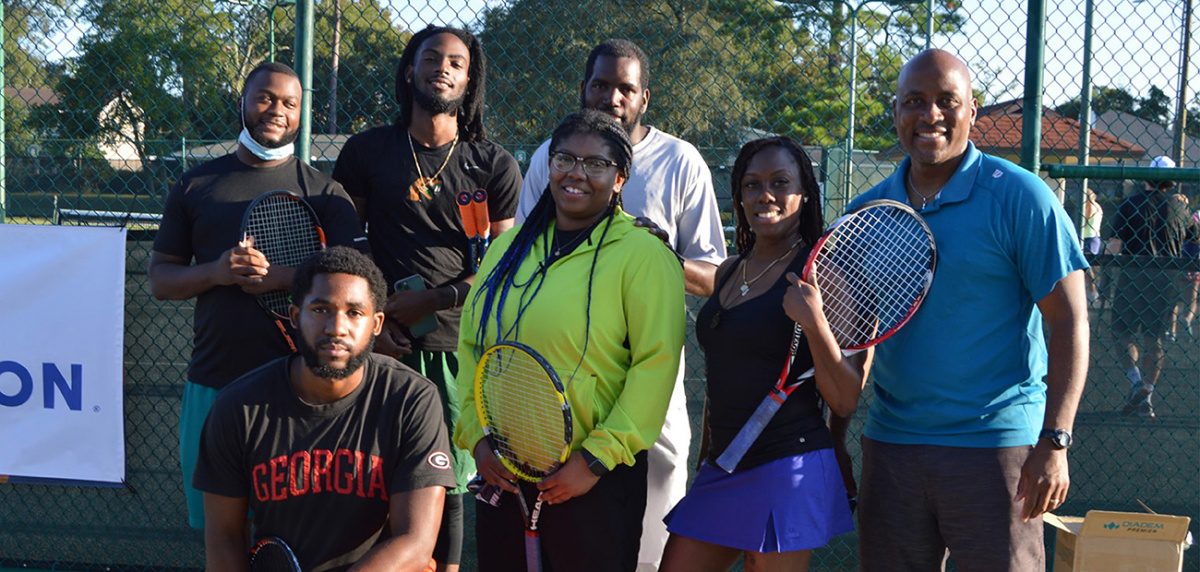
Turning Teens Into Champions
2022 Good Neighbor Award winner and REALTOR® MaliVai Washington uses his passion for tennis and kids to create life-changing opportunities for at-risk youth.
https://www.nar.realtor/good-neighbor-awards/turning-teens-into-champions

From Hunger to Happiness
2022 Good Neighbor Award Winner and REALTOR® Jennifer Barnes fed 10 families at the start of the pandemic. Now, her organization serves 25,000 households, addressing a wide range of community needs.
https://www.nar.realtor/good-neighbor-awards/from-hunger-to-happiness
Stay Current on Emerging Market Trends & News
Sign up for our daily newsletter ‘Navigate With NAR’ or
register to access all NAR newsletters.
register to access all NAR newsletters.
Please enter a valid email address. example@yourdomain.com
By subscribing to Navigate With NAR, managed by SmartBrief, you are agreeing to receive one daily email with news, offers, and information from the National Association of REALTORS® and SmartBrief. Visit our Privacy Policy. Easy unsubscribe links are provided in every email.
